Key points:
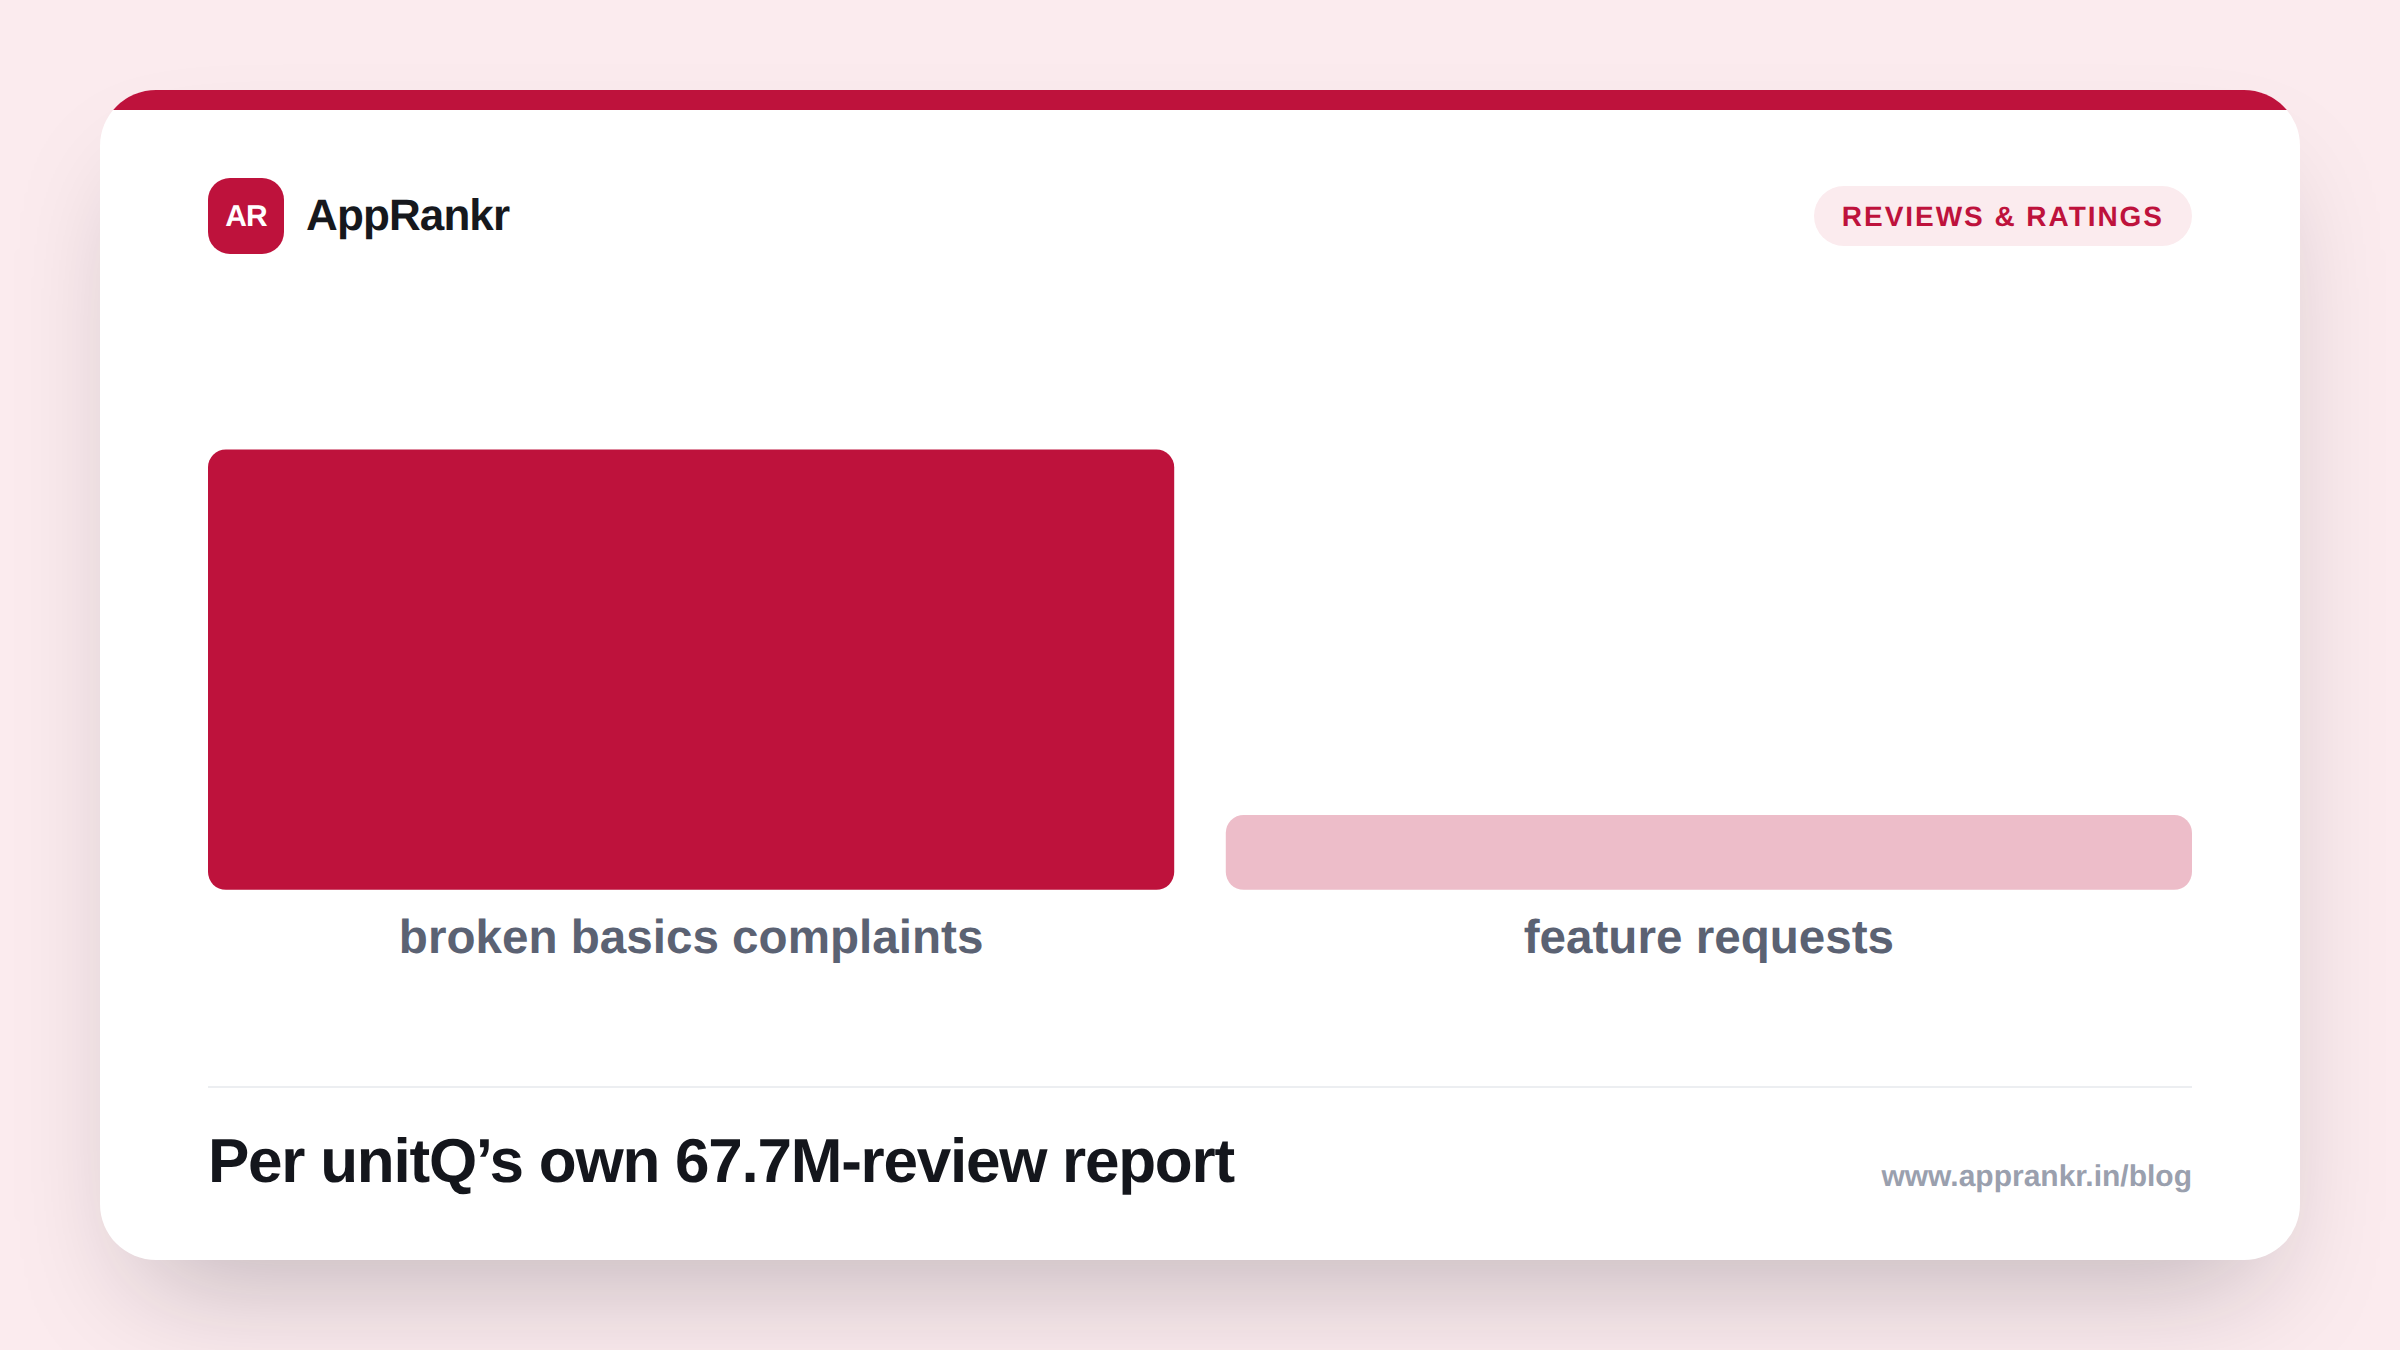
- unitQ’s 2026 Benchmark Report draws on 67.7 million App Store and Google Play reviews, across 8,000 apps. It found broken-basics complaints outnumber feature requests roughly 6 to 1.
- The report counted over 100,000 feature requests. Against 5.9 million quality issues, in that same pile of reviews.
- More than 555,000 complaints were about login failures or account access alone.
- Per reporting on the report, 80 to 85% of all crash and install complaints came from Android. unitQ sells feedback software, so treat these numbers as one vendor’s own data, not an outside, checked study.
Teams spend real time debating which feature to build next. A large review dataset says users are shouting about something else entirely.
What the report actually found
Per unitQ’s own report, the core imbalance is stark. Login problems. UI problems. Broken workflows. These dwarf requests for anything new. The report counted over 100,000 feature requests. Against 5.9 million quality issues, in the same dataset. Not a small gap. A whole different scale of complaint.
| Detail | What the report found |
|---|---|
| Dataset | 67.7 million reviews, 8,000 apps, 10 verticals |
| Complaint ratio | Roughly 6x more broken-basics complaints than feature requests |
| Login and account issues | Over 555,000 complaints |
| Stability complaints by platform | 80 to 85% originated on Android |
Why the Android stability number actually stands out
Most of this report covers both major platforms together. One number splits them apart. Most stability and install complaints, 80 to 85% per the reporting, trace back to Android. That’s not a small gap. If your app runs on both platforms, and your support queue feels Android-heavy for crashes or install failures, this report says it’s not just you. It may be a wider pattern. Across a huge sample of real reviews.
Real-world scenario: A shopping app’s product team had a roadmap full of new feature ideas. Most came from a handful of vocal power users. Reading unitQ’s report, they pulled their own review data instead. They found the same lopsided pattern. Login friction and a confusing checkout flow dominated the real complaints. Feature requests barely showed up. They shelved two planned features for a quarter. They fixed the login flow first instead. Their next review cycle showed that specific complaint drop sharply. A result new features likely wouldn’t have touched at all.
What to treat with real caution here
unitQ sells feedback software. This report exists partly to sell it. The numbers come from unitQ’s own AI. Not something an outside group checked or repeated. The 6x figure is real. The Android split is real too. Both come from a real, huge dataset. But they’re not independently checked facts. Treat them as a strong signal from one vendor. Worth checking against your own reviews. Not settled, audited truth.
What to actually do about it
- Pull your own complaint-to-feature-request ratio before assuming your roadmap reflects real demand. This report suggests most teams are probably off, in the same direction.
- Check your Android-specific stability and install complaints separately from iOS. The reported platform split is specific enough to be worth checking against your own data.
- Treat login and account access issues as a priority category, not routine support tickets. Over 555,000 complaints in this dataset sat in that bucket alone.
- Verify any of these figures against your own reviews before citing them as fact elsewhere. This is one vendor’s proprietary analysis, not an audited industry standard.
AppRankr’s ASO Inspector reviews your current listing alongside your real reviews, a useful way to check whether broken basics are quietly shaping your own rating.