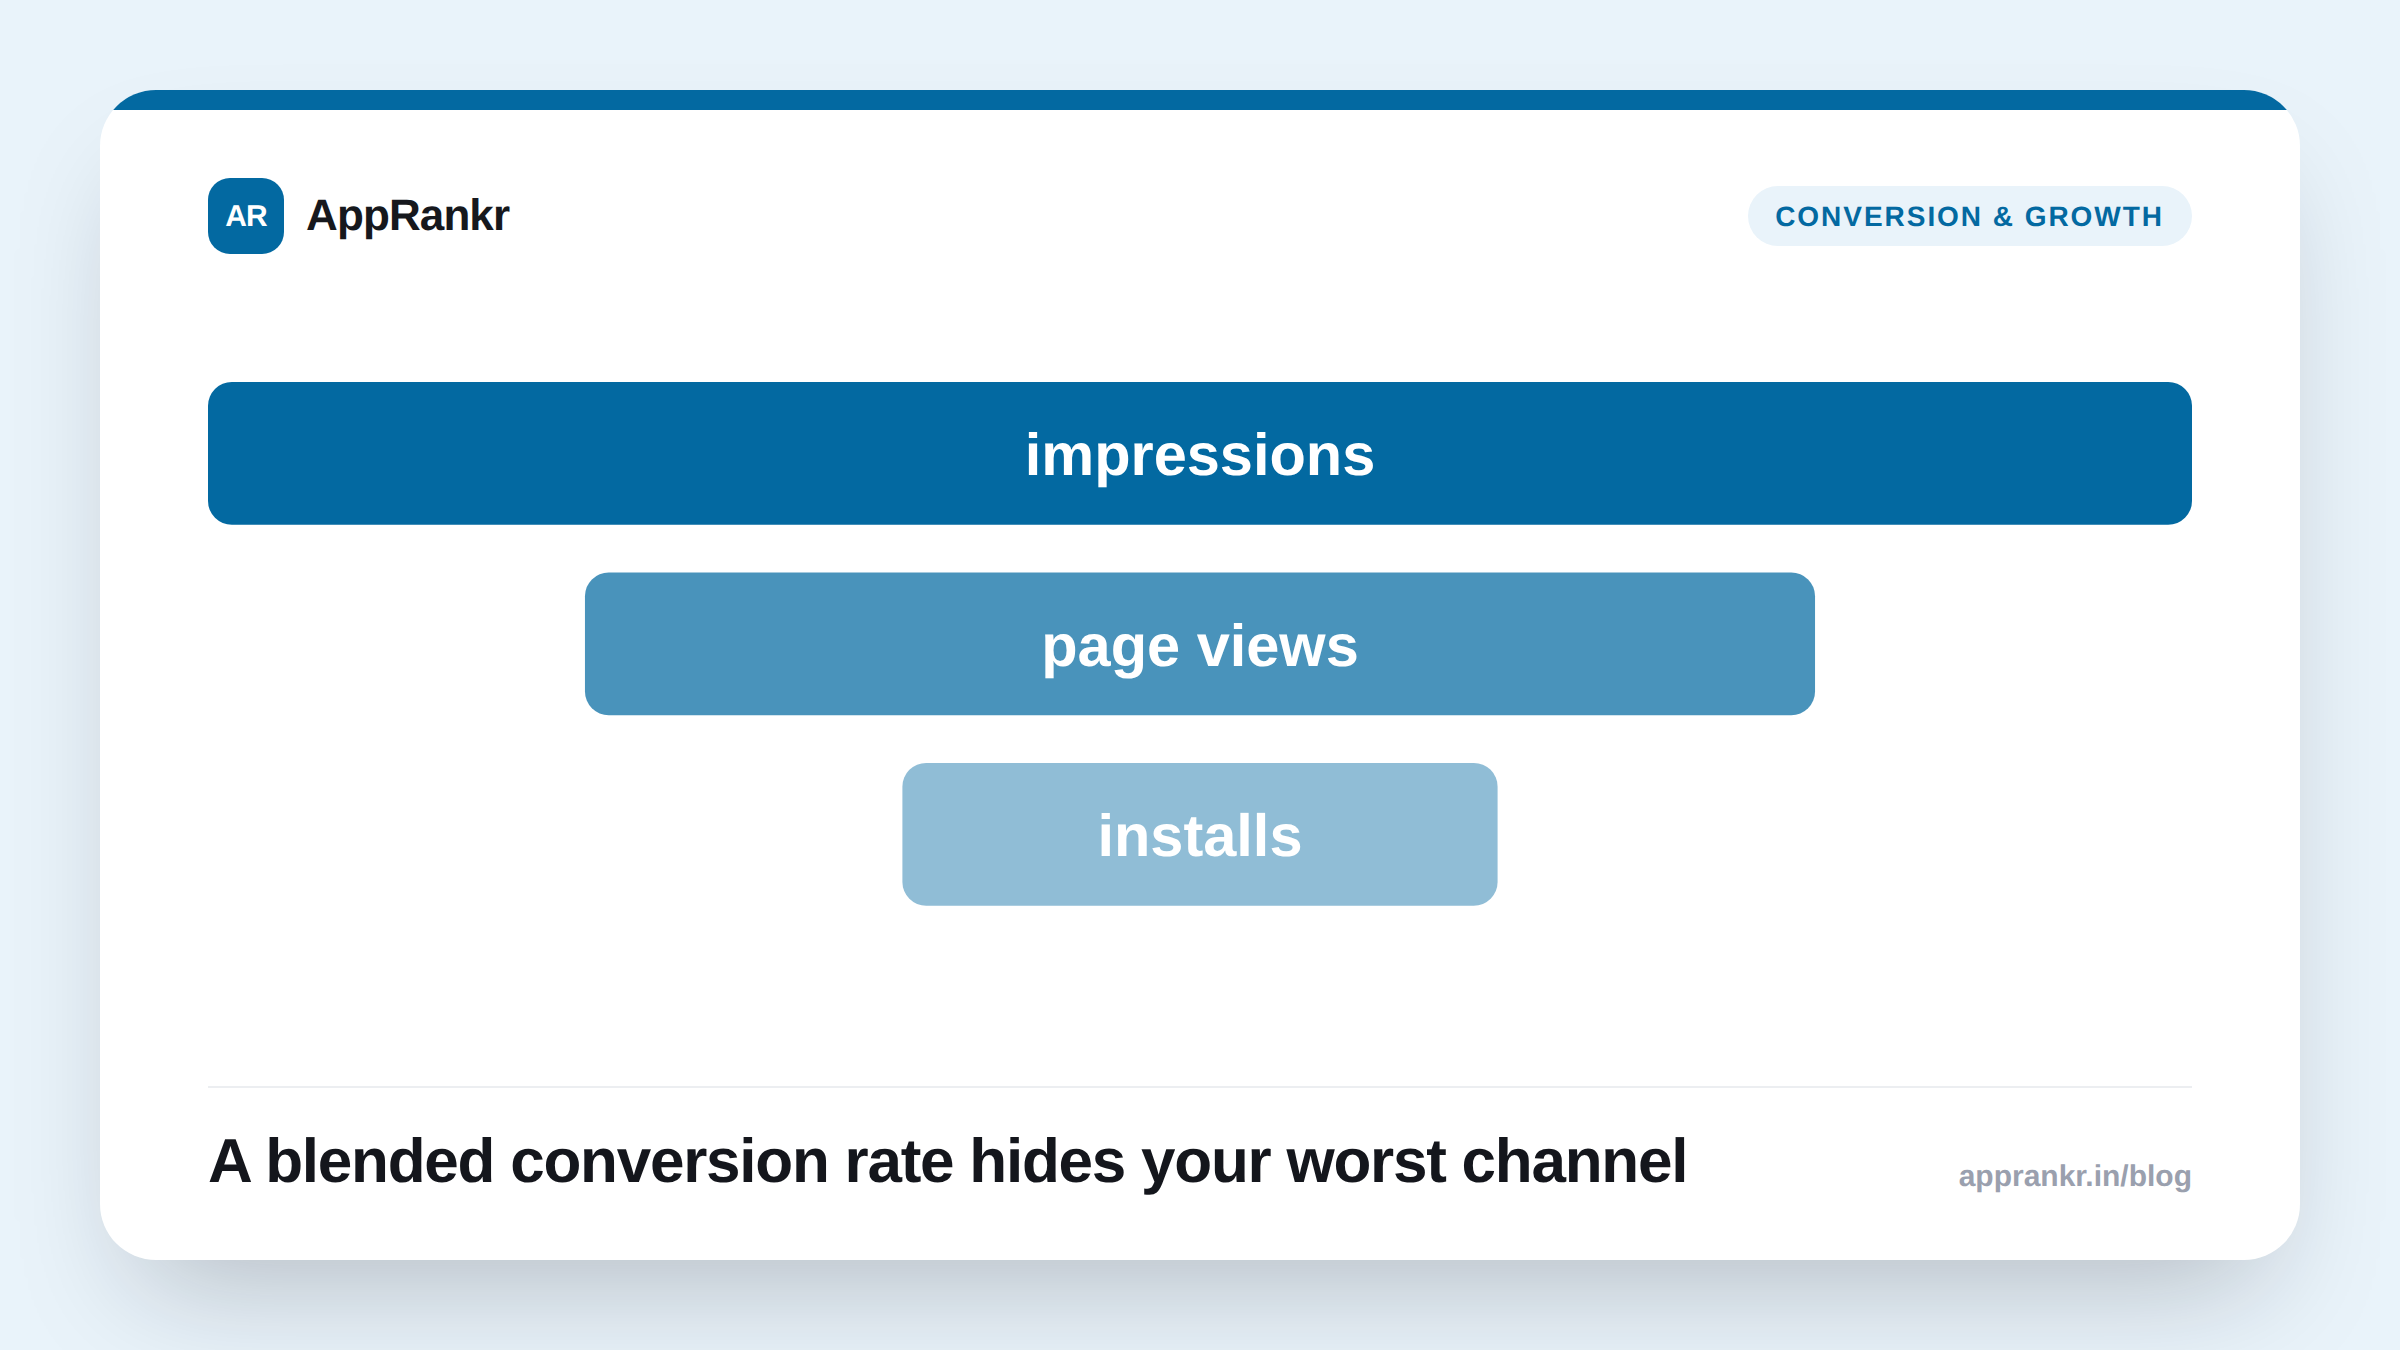
Total conversion rate is a fine number to glance at, but it answers a less useful question than it seems to. “Is my listing generally converting” matters less than “which channel is underperforming, and is that a listing problem or a traffic-quality problem”, and you can’t answer that from one blended figure.
Where the channel breakdown actually shows up
Google Play Console: the Acquisition report (under Grow, or within Statistics depending on your Console version) shows store listing visitors, installers, and conversion rate segmented by traffic source: organic search, explore/browse, third-party referrer, Google Ads, and others depending on how traffic arrived.
Apple App Store Connect: App Analytics reports impressions, product page views, and conversion rate segmented by source type: App Store search, App Store browsing (Today tab, categories, charts), App referrer (another app linking to yours), Web referrer, and Apple Search Ads where applicable.
Both platforms give you enough to separate “people who searched for something and found you” from “people who saw you while browsing” from “people who arrived via an ad or an external link”, three meaningfully different audiences with different expectations walking in.
Why the channels convert differently: and what that tells you
Organic search traffic usually has the clearest intent: they typed something close to what your app does and you matched it. If organic search conversion is lower than you’d expect, that’s often a message-match problem. Your listing isn’t confirming what the searcher was hoping to find quickly enough (title/icon/first screenshot).
Browse/explore traffic has weaker intent by definition. They weren’t looking for you specifically. Lower conversion here is normal and not automatically a red flag; the more useful question is whether it’s trending down over time.
Paid traffic conversion depends heavily on how well the ad’s creative and targeting match what the listing actually shows. A mismatch between ad promise and listing reality shows up as a paid-channel conversion rate that lags organic, even with a perfectly good listing.
Referral traffic (from another app, or an external link) inherits whatever context that referring source set up, a review site’s glowing writeup sends a warmer audience than a generic cross-promotion banner.
What a channel breakdown actually looks like
| Channel | Visitors | Installs | Conversion rate |
|---|---|---|---|
| Organic search | 8,200 | 1,230 | 15.0% |
| Browse / explore | 6,500 | 585 | 9.0% |
| Paid campaign | 3,100 | 217 | 7.0% |
| Referral (external link) | 900 | 144 | 16.0% |
| Blended (all channels) | 18,700 | 2,176 | 11.6% |
Real-world scenario: The blended 11.6% conversion rate above looks perfectly healthy on its own. But organic search (highest-intent traffic) converting at 15% while paid campaign traffic converts at less than half that rate points at a real problem: the ad creative was promising a feature set the listing didn’t lead with. Fixing the ad-to-listing message match (not the listing itself) was the actual lever, something a single blended number would never have surfaced.
Turning this into a decision, not just a dashboard
The useful move isn’t reporting all four numbers. It’s using the gap between them to decide where to spend effort:
- Organic conversion lower than browse conversion is unusual and worth investigating first. It suggests your listing doesn’t confirm the specific thing people searched for, which is exactly what title/short-description/first-screenshot relevance is supposed to fix.
- Paid conversion meaningfully below organic points at a creative/targeting mismatch in the campaign itself, not necessarily a listing problem. Check what the ad promises against what the listing actually opens with.
- A channel with strong conversion but a shrinking share of total traffic is a growth opportunity being under-invested in, not a listing issue at all.
- A channel with weak conversion but a growing share of total traffic is the one to watch. It’ll start dragging your blended average down even if nothing about your listing changed.
Track these as a trend, the same way you’d track keyword rank or rating share over time. A single snapshot tells you where you stand today, but the direction of each channel’s conversion rate over weeks is what actually tells you whether something needs fixing.