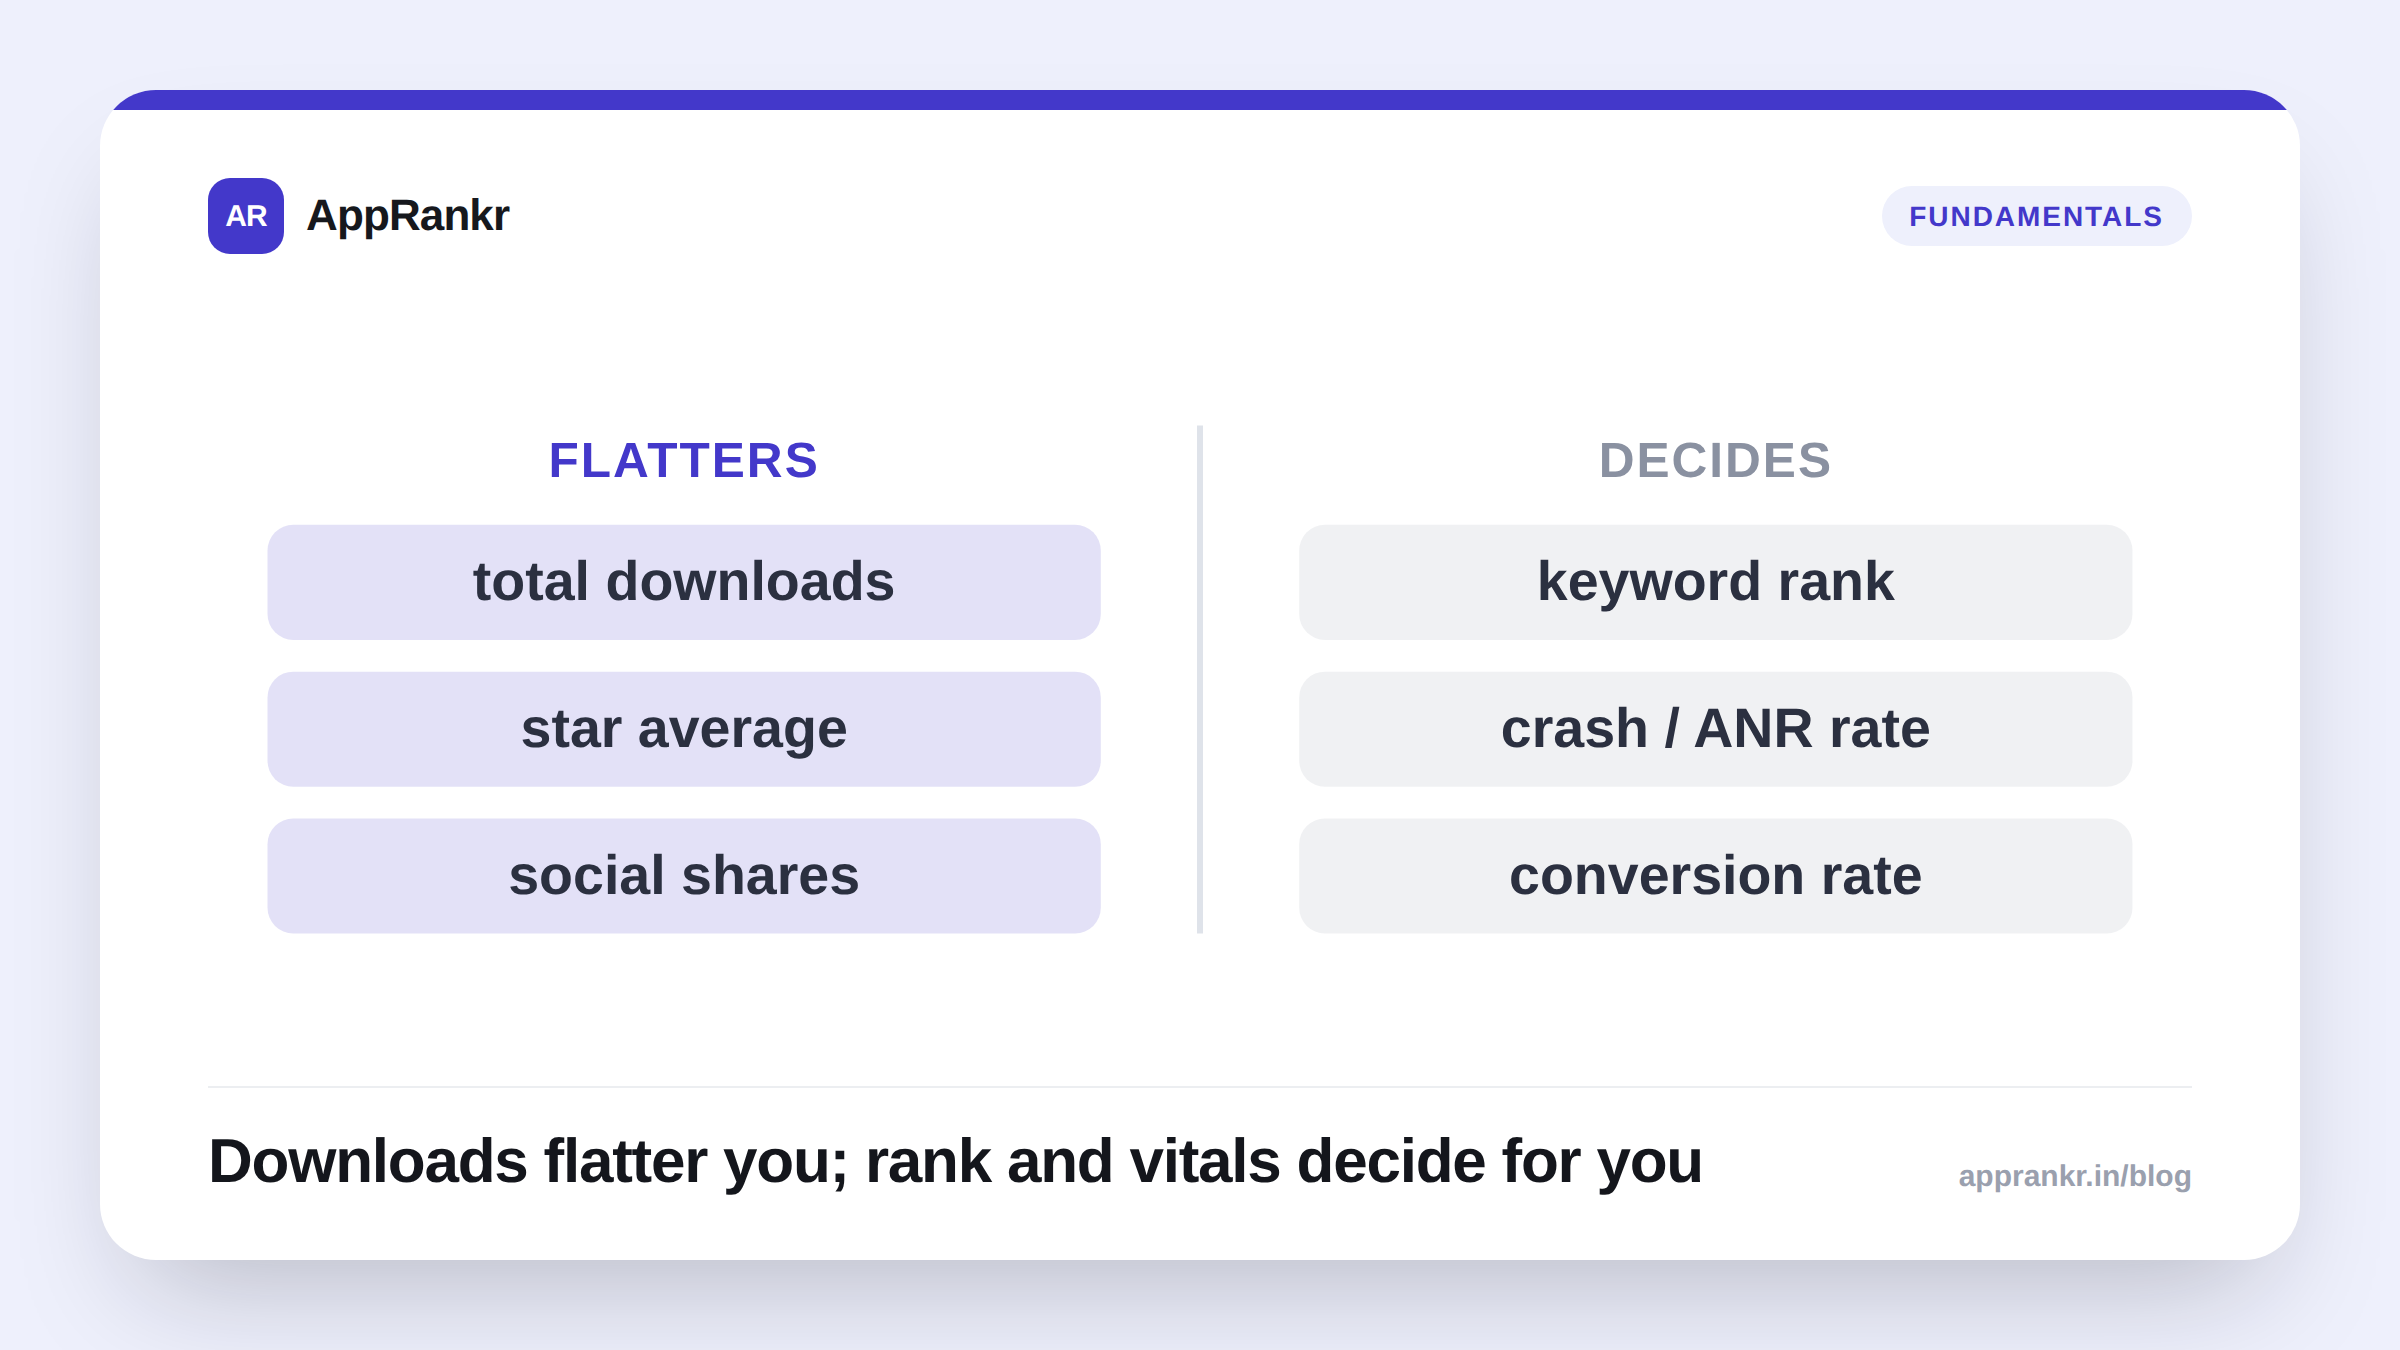
Every app has two dashboards’ worth of numbers competing for attention: the ones that look good in a screenshot (total downloads, average star rating, follower counts) and the ones that actually correlate with where the app shows up in search. They’re not the same list, and mixing them up leads to optimizing for the number that photographs well instead of the one that moves the needle.
The two lists, side by side
| Metric | Good for | Ranking relevance |
|---|---|---|
| Total lifetime downloads | Investor decks, App Annie-style press | Not directly confirmed; recent install velocity matters more than a historical total |
| Average star rating (all-time) | First impression, conversion on the listing page | Indirect, affects whether people install, less evidence it’s a direct rank input on its own |
| Recent install velocity | n/a | Better supported as a ranking-relevant signal than lifetime total |
| Recent rating velocity / 1-2★ share | n/a | Better supported. See the reviews and rank post below |
| Keyword-level search rank | n/a | The thing you’re actually trying to move |
| Retention / uninstall rate | n/a | Reasonably well supported as store-guidance-relevant, though the exact weighting isn’t published |
The right column is short on purpose. Both stores confirm relatively little about their exact ranking mechanics, and the gap between “everyone repeats this” and “this is actually documented” is wide enough that it’s worth being explicit about which side of the line each number sits on.
Why lifetime totals mislead
A number like “10 million downloads” describes the past, not the present. An app that hit that total three years ago and has had flat or declining recent installs since is a very different competitive position than an app with a fraction of the lifetime total but strong, current install momentum, and the second one is the one better positioned to actually win a search-rank fight today, because recency is where the documented signal lives.
Real-world scenario: A legacy photo-editing app had 20M+ lifetime downloads and led with that number in every pitch deck. A two-year-old competitor with under 500K lifetime downloads but a steady, growing weekly install rate and a 4.7 average outranked it for the category’s main keyword within the same year. The legacy app’s own recent installs had been flat for over a year, while the newer app’s were climbing every month. The lifetime total didn’t protect a position that recent activity had already stopped earning.
What to actually watch instead
- Track your own visibility score and keyword rank over time, not a static download counter. A trend you can chart tells you whether your current trajectory is up or down; a lifetime total only ever goes up and can’t tell you that.
- Watch rating velocity and recent 1-2★ share, not just the all-time average. A rating trend that’s sliding is a leading indicator worth catching early, well before it drags the all-time number down enough to notice on the listing page.
- Compare yourself to competitors on the metrics that plausibly matter, not the ones that make a nicer headline, a visibility-score comparison against the apps you actually compete with is a more honest read on standing than a download-count leaderboard either of you could pull from a public estimate tool.
- Treat “everyone quotes this number” as a reason to double-check it, not to trust it more: vanity metrics get repeated precisely because they’re easy to state and flattering to lead with, not because they’ve been shown to move rank.
The number that looks best on a slide and the number that’s actually worth optimizing for are rarely the same one. Knowing which is which is most of the value in not wasting effort on the wrong target.