Key points:
- Apple’s own definition, quoted directly from its App Store Connect documentation: conversion rate is “total downloads and pre-orders divided by unique device impressions.”
- Google Play’s version compares store listing visitors (people who viewed your listing without installing) against store listing acquisitions (the installs from that same group).
- Published benchmark figures vary wildly, even within a single research vendor’s own reports. Sometimes by 2-3x. Treat any single quoted average with real caution.
- The documented, common causes of a stuck conversion rate cluster around the same few things. The first screenshot. The icon. The rating. Price surprise.
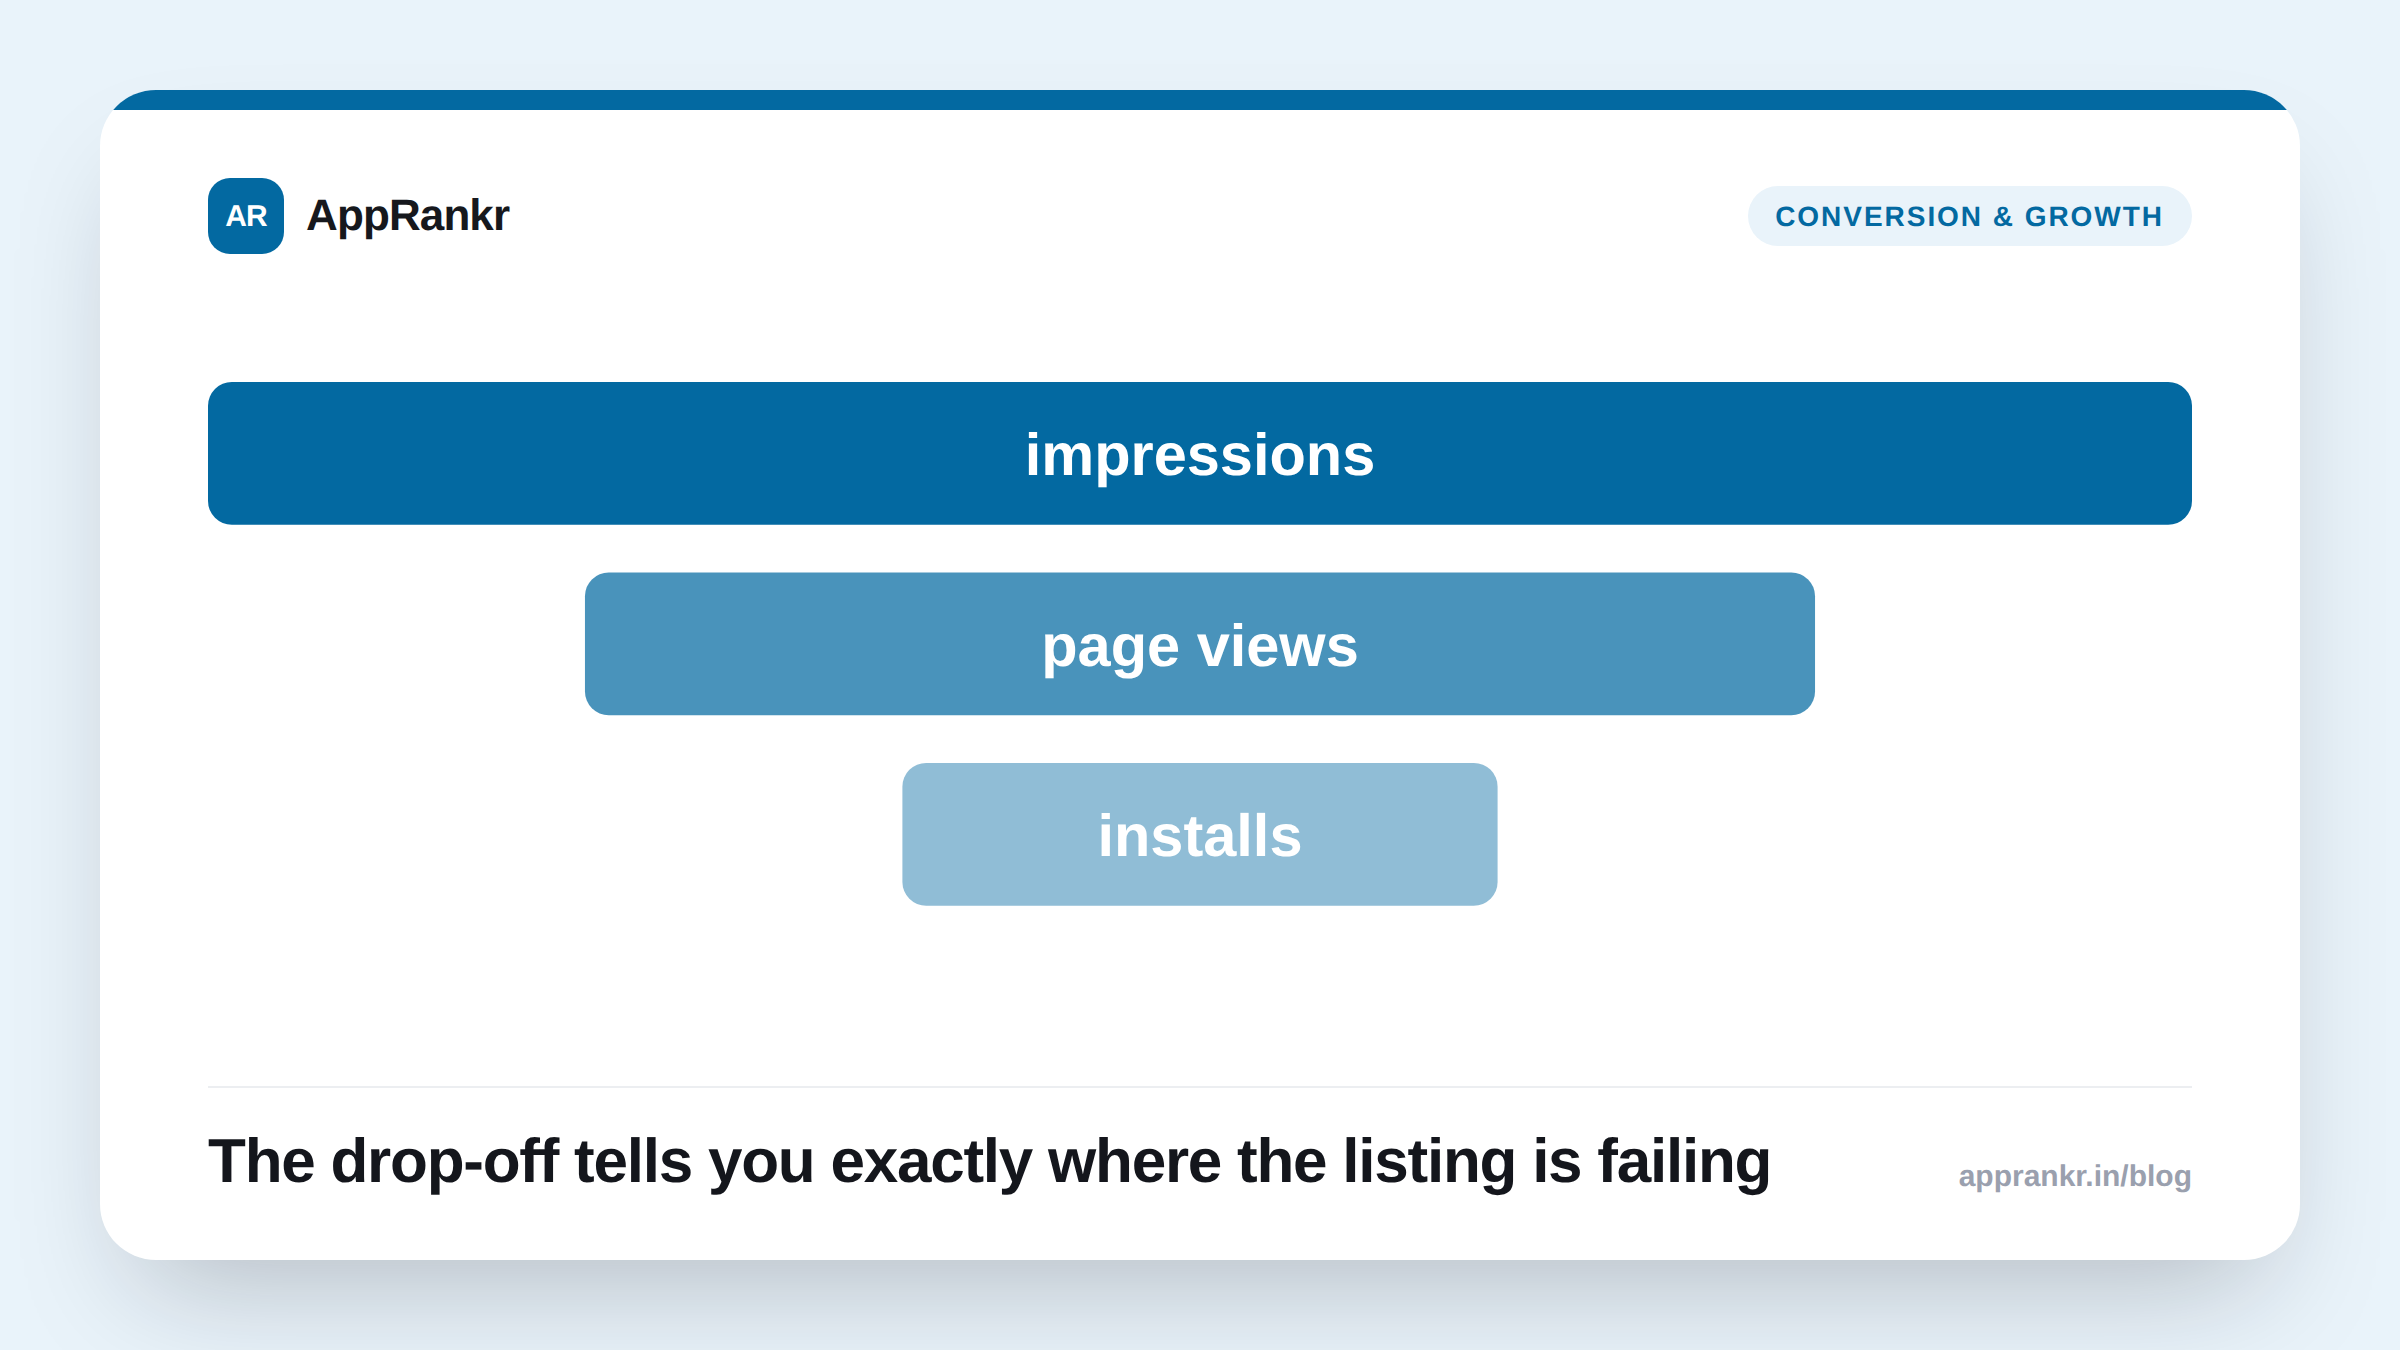
Your impressions chart is climbing. Your install count isn’t. That gap is one of the most common things developers ask about. It has a name. The name doesn’t tell you what’s actually broken, though. Here’s what the metric really measures, and where a stuck listing usually fails.
What “conversion rate” actually means, per platform
Apple’s own documentation is direct here. Conversion rate is “total downloads and pre-orders divided by unique device impressions.” Impressions themselves are defined narrowly too. “The number of times your app was viewed on the Today, Games, Apps, and Search tabs of the App Store for more than one second,” plus product page views. Apple only starts showing you these metrics once your app has at least 5 first-time downloads or pre-orders.
Google Play frames it a bit differently. Store Listing Visitors counts unique users who viewed your listing without already having the app installed. Store Listing Acquisitions counts the installs from that same pool of visitors. Conversion rate is acquisitions divided by visitors. Play Console shows you a peer comparison bar right next to your own number.
| Platform | What counts as a “view” | What counts as a “conversion” |
|---|---|---|
| Apple | Impression (over 1 second) or product page view | Download or pre-order |
| Google Play | Store listing visit (not already installed) | Store listing install |
Ignore the headline benchmark numbers
You’ll see quoted average conversion rates all over ASO vendor content. Be careful with them. The same research vendor can publish one figure in one report and a number nearly 3x different in another. That’s because they’re not always measuring the same thing. Impressions-based rates and page-view-based rates aren’t the same. Neither is a rate that only counts search traffic versus one counting every discovery surface at once.
The only fair comparison is your own rate against your own history. Or your own rate against Play Console’s peer-benchmark bar for your category. A headline “average conversion rate is X%” from a vendor blog means little without knowing exactly what they divided by what.
Where a stuck listing usually breaks
Across ASO practitioner writing, the same few causes come up again and again when impressions are healthy but installs aren’t:
- The first screenshot doesn’t say anything. A visitor scans your listing for a couple seconds. If the very first image doesn’t show what the app does, most people never reach screenshot two.
- Your icon or screenshots don’t match category expectations. A finance app that looks like a game, or a game that looks like a spreadsheet, reads as wrong before anyone reads the description.
- Your rating is too low, or too thin to trust. A 3.9 with 40 reviews reads very differently than a 3.9 with 4,000. Both numbers are honest. Only one looks safe to install.
- Price surprises the visitor. If ad creative, search intent, or category norms suggested “free,” and the listing shows a price or a paywall up front, a chunk of visitors leave right there.
Real-world scenario: A productivity app’s impressions rose sharply after a feature in a roundup article. Its install count barely moved for two weeks. The team checked their funnel and confirmed the traffic was real, not bot or fraud traffic. The same lift showed up consistently on both platforms. They then looked at their own product page like a first-time visitor would. Their first screenshot was a settings screen, not the actual feature people came to see. They swapped it for a screenshot of that exact feature in action, with a short text headline over it. Conversion rate on that same traffic source roughly doubled within a week. Nothing else changed.
What to actually check, in order
- Confirm the impression increase is real and durable. Not a one-day spike from a referral source that won’t repeat.
- Look at your own product page like a first-time visitor. Does the first screenshot show what the app does within a couple seconds, without reading the description?
- Check your rating and review count together, not separately. A low count next to a mediocre score compounds the problem.
- Confirm there’s no pricing surprise between what drove the visit and what the listing actually shows.
AppRankr’s ASO Inspector reviews your live listing against exactly this kind of checklist. Pair it with Rank Tracker to see whether a listing change actually moved your numbers, not just guess that it did.